
ApogeeMix: A Reference for Flow Cytometry Performance Assessment & Calibration
ApogeeFlow offers a wide range of beads which can be purchased by sending an email to info@ApogeeFlow.com. Payment will be handled via credit card (secure payment link) for new customers or invoice for our existing clients.
The complex relationship between particle size and the amount of light scattered at different collection angles makes it difficult to infer particle size from a flow cytometer's light scatter data. A population may be described as scattering an amount of light equal to a reference particle (e.g. a polystyrene or silica bead of known size) but same sized particles of different refractive index (ɳ) give different signal strengths. When comparing data between flow cytometers the difficulties are compounded by differences in light scatter collection angles. Ideally it would be possible to produce stable reference particles of known size and of a refractive index and structure similar to the bacteria or microvesicles of interest, but such particles are not commercially available, expensive or relatively unstable.
Due to the refractive index difference, polystyrene beads on their own do not offer an accurate means to assess a flow cytometer's light scatter performance for the study of biological particles. Silica (SiO2) beads can be used as a better reference particle because silica's refractive index is closer to the refractive index of biological vesicles 1,2,3,4.
Product range
| Cat number | Polystyrene (nm) | Silica (nm) |
Fluorescence excitation | Fluorescence emission |
Content per microlitre +/- 20% | Volume (ml) |
|---|---|---|---|---|---|---|
| 1408 | 1000 | UV | Violet | 3000 | 40 | |
| 1416 | 2000 | Blue | Green | 10000 | 40 | |
| 1419 | 500 | Blue | Green | 5000 | 40 | |
| 1421 | 1000 | Violet | Yellow/Green | 5000 | 40 | |
| 1426 | 1000 | Blue | Yellow/Green | 5000 | 40 | |
| 1446 | 500 | Yellow/Green | 10000 | 40 | ||
| 1464 | 1000 | Green | Red | 5000 | 40 | |
| 1465 | 200 | Blue | Yellow/Green | 5000 | 40 | |
| 1478 | 2000 | Red | Deep Red (>650nm) | 2000 | 40 | |
| 1484 | 1000 | Blue | Yellow/Green | 50000 | 10 | |
| 1488 | 110 | Blue | Green | 10000 | 25 | |
| 1493 | 110/500 | 180/240/300/590/880/1300 | see below | see below | 25 | |
| 1494 | 2000 | Green | Red | 2000 | 40 | |
| 1502 | 880 | None | None | 2500 | 40 | |
| 1503 | 300 | 2500 | 40 | |||
| 1506 | 1300 | 2500 | 40 | |||
| 1507 | 180 | 2500 | 40 | |||
| 1508 | 590 | 2500 | 40 | |||
| 1512 | 240 | 2500 | 40 | |||
| 1513 | 80 | 405nm | Green | 10000 | 40 | |
| 1518 | 500 | Red | Deep Red | 5000 | 40 | |
| 1525 | 500 | Violet | Yellow/Green | 5000 | 40 | |
| 1527 | 80/110/500 | 180/240/300/590/880/1300 | see below | see below | 25 | |
| 1528 | 1000 | Red | Deep Red (>650nm) | 5000 | 40 |
To purchase please send an email to info@apogeeflow.com. Payment will be handled via credit card (secure payment link) for new customers or invoice for our existing clients.
Most purchased: ApogeeMix #1493 & 1527
The ApogeeMix products (Cat #1493 & 1527) are a convenient mixture of non-fluorescent silica beads and fluorescent polystyrene beads, with diameters 180nm, 240nm, 300nm, 590nm, 880nm and 1300nm diameter with refractive index ɳ=1.43 (Silica, SiO2). It also contains 80nm (#1527 only), 110nm and 500nm green fluorescent beads with refractive index ɳ=1.59 (Polystyrene).
The product is intended to assess a flow cytometer's light scatter and fluorescence performance. It will provide useful points of reference for light scatter data and prepare flow cytometers for the analysis of small particles by providing points of reference.
The fluorescent polystyrene beads may be used to assess the fluorescence sensitivity and to assess the performance of the flow cytometer's optics at a different refractive index.
Approximate particle concentrations (lots vary):
| Cat number | Polystyrene (nm) |
Silica (nm) | Fluorescence excitation |
Fluorescence emission | Content per microlitre +/- 20% |
Volume (ml) |
|---|---|---|---|---|---|---|
| 1493 & 1527 |
80 (#1527 only) | 405nm | Green | 5000 | 25 | |
| 110 | 405nm / 488nm | Green | 5000 | |||
| 180 | None | 5000 | ||||
| 240 | None | 10000 | ||||
| 300 | None | 9000 | ||||
| 500 | 405nm / 488nm | Green | 3600 | |||
| 590 | None | 2700 | ||||
| 880 | None | 3900 | ||||
| 1300 | None | 3400 |
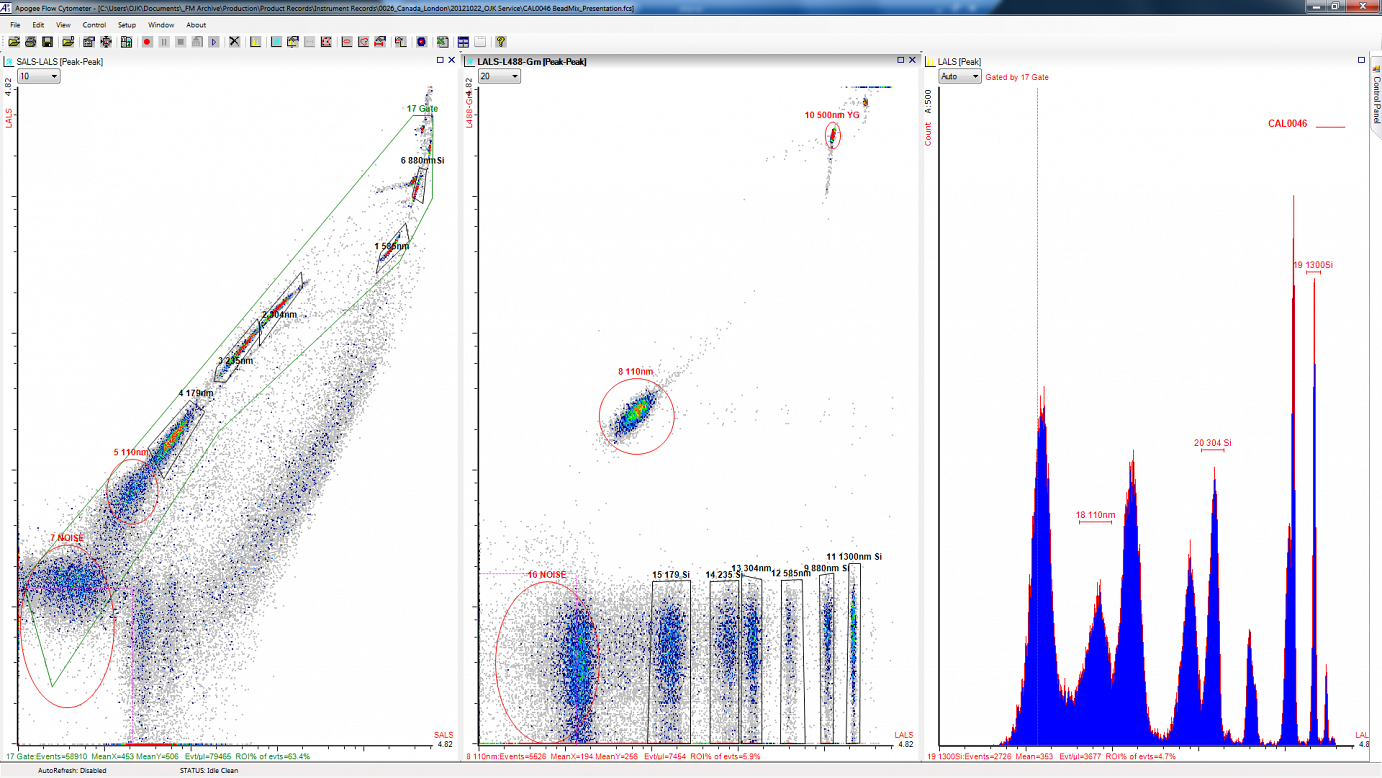
Data from ApogeeFlow standard "Micro” Cytometer
The resolution of the peaks indicates the flow cytometer's performance. The below image is from #1493 ApogeeMix measured on a standard ApogeeFlow "Micro” Cytometer. A "MicroPLUS” model would offer more than an extra decade of light scatter sensitivity. Ideally eight populations will be resolved from each other and resolved from instrument noise:
- 6 populations with refractive index 1.43 (silica, SiO2)
and
- 2 green fluorescent (405nm or 488nm laser) populations (110nm and 500nm) with refractive index 1.59 (polystyrene), middle graph. Product #1527 also contains 80nm polystyrene beads (green fluorescent from 405nm laser excitation, not shown in data below).
Ordering Information
Please email purchase orders and price requests to info@ApogeeFlow.com.
Product Safety
Caution: Product contains 0.05% sodium azide.
MSDS available on request (info@ApogeeFlow.com)
References
- Journal of Thrombosis and Haemostasis 2011 Jun, 9(6):1216-24
A new microparticle size calibration standard for use in measuring smaller microparticles using a new flow cytometer Chandler, W., Yeung, Wandy, Tait, Jonathan.
- Water Research 42 (2008) 3757 - 3766
Use of silica microspheres having refractive index similar to bacteria for conversion of flow cytometric forward light scatter into biovolume Paola Foladori, Alberto Quaranta, Giuliano Ziglio.
- J Thromb Haemost 2014; DOI:10.1111/jth.12602 van der Pol E, Coumans FAW, Grootemaat AE, Gardiner C, Sargent IL, Harrison P, Sturk A, van Leeuwen TG, Nieuwland.
Particle size distribution of exosomes and microvesicles determined by transmission electron microscopy, flow cytometry, nanoparticle tracking analysis, and resistive pulse sensing.
- American Chemical Society 2014 Oct, 2 p.6195-6201 Edwin van der Pol et al
Refractive index determination of nanoparticles in suspension using nanoparticle tracking analysis.
